2026
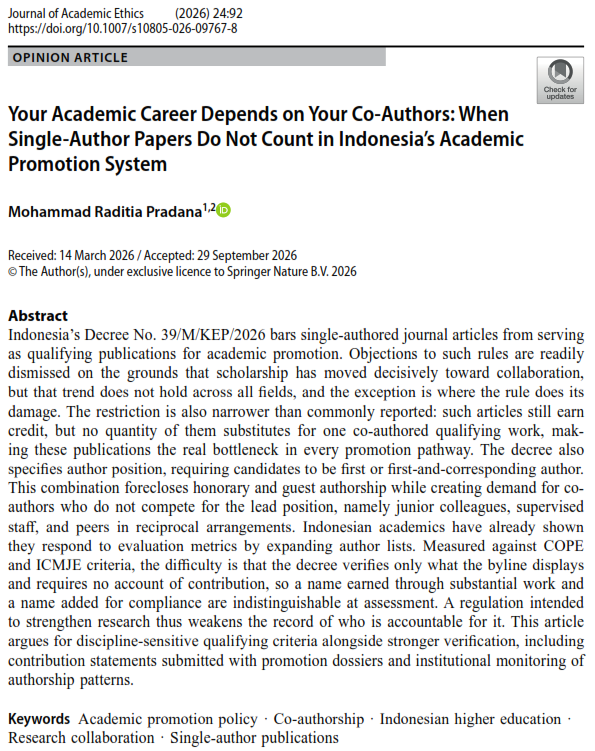
Your Academic Career Depends on Your Co-Authors: When Single-Author Papers Do Not Count in Indonesia’s Academic Promotion System
Mohammad Raditia Pradana# (# corresponding author)
Journal of Academic Ethics 2026
Indonesia’s Decree No. 39/M/KEP/2026 bars single-authored journal articles from serving as qualifying publications for academic promotion. Objections to such rules are readily dismissed on the grounds that scholarship has moved decisively toward collaboration, but that trend does not hold across all fields, and the exception is where the rule does its damage. The restriction is also narrower than commonly reported: such articles still earn credit, but no quantity of them substitutes for one co-authored qualifying work, making these publications the real bottleneck in every promotion pathway. The decree also specifies author position, requiring candidates to be first or first-and-corresponding author. This combination forecloses honorary and guest authorship while creating demand for co-authors who do not compete for the lead position, namely junior colleagues, supervised staff, and peers in reciprocal arrangements. Indonesian academics have already shown they respond to evaluation metrics by expanding author lists. Measured against COPE and ICMJE criteria, the difficulty is that the decree verifies only what the byline displays and requires no account of contribution, so a name earned through substantial work and a name added for compliance are indistinguishable at assessment. A regulation intended to strengthen research thus weakens the record of who is accountable for it. This article argues for discipline-sensitive qualifying criteria alongside stronger verification, including contribution statements submitted with promotion dossiers and institutional monitoring of authorship patterns.
Your Academic Career Depends on Your Co-Authors: When Single-Author Papers Do Not Count in Indonesia’s Academic Promotion System
Mohammad Raditia Pradana# (# corresponding author)
Journal of Academic Ethics 2026
Indonesia’s Decree No. 39/M/KEP/2026 bars single-authored journal articles from serving as qualifying publications for academic promotion. Objections to such rules are readily dismissed on the grounds that scholarship has moved decisively toward collaboration, but that trend does not hold across all fields, and the exception is where the rule does its damage. The restriction is also narrower than commonly reported: such articles still earn credit, but no quantity of them substitutes for one co-authored qualifying work, making these publications the real bottleneck in every promotion pathway. The decree also specifies author position, requiring candidates to be first or first-and-corresponding author. This combination forecloses honorary and guest authorship while creating demand for co-authors who do not compete for the lead position, namely junior colleagues, supervised staff, and peers in reciprocal arrangements. Indonesian academics have already shown they respond to evaluation metrics by expanding author lists. Measured against COPE and ICMJE criteria, the difficulty is that the decree verifies only what the byline displays and requires no account of contribution, so a name earned through substantial work and a name added for compliance are indistinguishable at assessment. A regulation intended to strengthen research thus weakens the record of who is accountable for it. This article argues for discipline-sensitive qualifying criteria alongside stronger verification, including contribution statements submitted with promotion dossiers and institutional monitoring of authorship patterns.
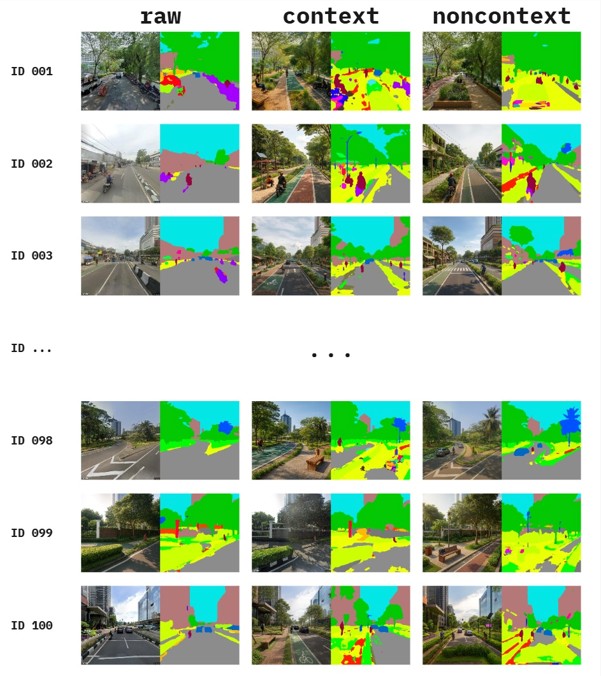
Interpreting ‘sustainable’ urban streetscapes with generative AI: Context-rich vs. generic prompting
Mohammad Raditia Pradana*#, Ahmad Gamal*, Jagannath Aryal (* equal contribution, # corresponding author)
Ongoing-Under review. 2026
Interpreting ‘sustainable’ urban streetscapes with generative AI: Context-rich vs. generic prompting
Mohammad Raditia Pradana*#, Ahmad Gamal*, Jagannath Aryal (* equal contribution, # corresponding author)
Ongoing-Under review. 2026
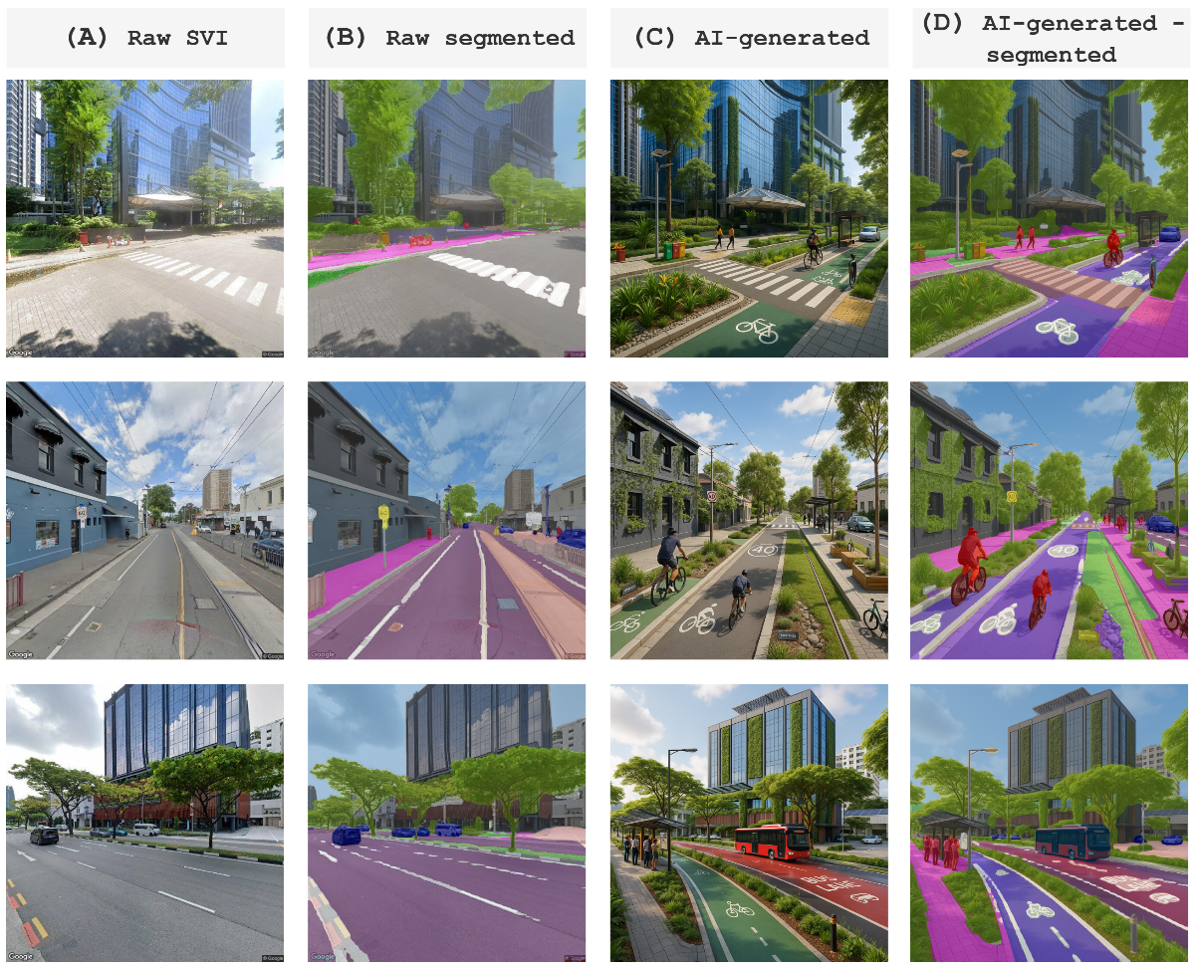
Reframing urban "sustainable" streetscapes: Evidence from cross-city transformation and convergence
Mohammad Raditia Pradana*, Ahmad Gamal*#, Jagannath Aryal (* equal contribution, # corresponding author)
Ongoing-Under review. 2026
Reframing urban "sustainable" streetscapes: Evidence from cross-city transformation and convergence
Mohammad Raditia Pradana*, Ahmad Gamal*#, Jagannath Aryal (* equal contribution, # corresponding author)
Ongoing-Under review. 2026
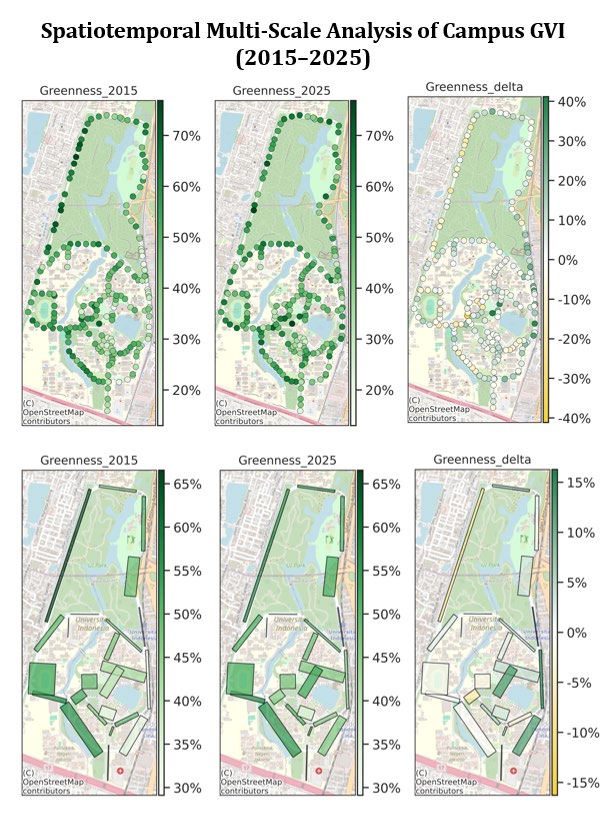
Visualizing Sustainable Campuses: A Spatiotemporal Deep Learning Analysis of Eye-Level Greenery
Jarot Mulyo Semedi*#, Mohammad Raditia Pradana*, Cheryl Ferrarichka Permata, Roddy Aprilian Pratama, Maria Andriana Nea Candra, Nurul Sri Rahatiningtyas, Muhammad Dimyati# (* equal contribution, # corresponding author)
IOP Conf. Series: Earth and Environmental Science 2026
Urban green spaces on university campuses are essential for microclimate regulation, student mental health, and institutional sustainability rankings (e.g., UI GreenMetric and QS World University Rankings). However, traditional top-down remote sensing predominantly measures canopy area, often failing to capture the human-centric, "eye-level" experience of pedestrian greenery. This study investigates the spatiotemporal dynamics of campus vegetation by quantifying changes in pedestrian-level greenness over an approximately decade-long period. Utilizing historical Google Street View (GSV) imagery from 2015 to 2025, we extracted panoramic images along the road network of Universitas Indonesia campus. A deep learning-based semantic segmentation model, namely Mask2Former, was applied to isolate vegetation pixels and calculate the Green View Index (GVI) for each temporal epoch. Statistical and spatial analyses were then conducted to map hotspots of greenery gain and loss. Our analysis reveals that the average campus GVI are changing. While localized greening occurred due to landscaping projects, significant greenery loss was identified in areas associated with new infrastructure development. The findings highlight a divergence between top-down green coverage and eye-level green exposure. We argue that historical street view imagery provides a highly effective, human-centric metric for campus planners to evaluate environmental interventions, ensuring that infrastructure expansion does not compromise the visual and psychological benefits of campus greenery.
Visualizing Sustainable Campuses: A Spatiotemporal Deep Learning Analysis of Eye-Level Greenery
Jarot Mulyo Semedi*#, Mohammad Raditia Pradana*, Cheryl Ferrarichka Permata, Roddy Aprilian Pratama, Maria Andriana Nea Candra, Nurul Sri Rahatiningtyas, Muhammad Dimyati# (* equal contribution, # corresponding author)
IOP Conf. Series: Earth and Environmental Science 2026
Urban green spaces on university campuses are essential for microclimate regulation, student mental health, and institutional sustainability rankings (e.g., UI GreenMetric and QS World University Rankings). However, traditional top-down remote sensing predominantly measures canopy area, often failing to capture the human-centric, "eye-level" experience of pedestrian greenery. This study investigates the spatiotemporal dynamics of campus vegetation by quantifying changes in pedestrian-level greenness over an approximately decade-long period. Utilizing historical Google Street View (GSV) imagery from 2015 to 2025, we extracted panoramic images along the road network of Universitas Indonesia campus. A deep learning-based semantic segmentation model, namely Mask2Former, was applied to isolate vegetation pixels and calculate the Green View Index (GVI) for each temporal epoch. Statistical and spatial analyses were then conducted to map hotspots of greenery gain and loss. Our analysis reveals that the average campus GVI are changing. While localized greening occurred due to landscaping projects, significant greenery loss was identified in areas associated with new infrastructure development. The findings highlight a divergence between top-down green coverage and eye-level green exposure. We argue that historical street view imagery provides a highly effective, human-centric metric for campus planners to evaluate environmental interventions, ensuring that infrastructure expansion does not compromise the visual and psychological benefits of campus greenery.
Indonesia’s urban green spaces dilemma: Balancing law, ecology, and public space, highlighting Jakarta
Mohammad Raditia Pradana#, Jarot Mulyo Semedi (# corresponding author)
Human Geography 2026
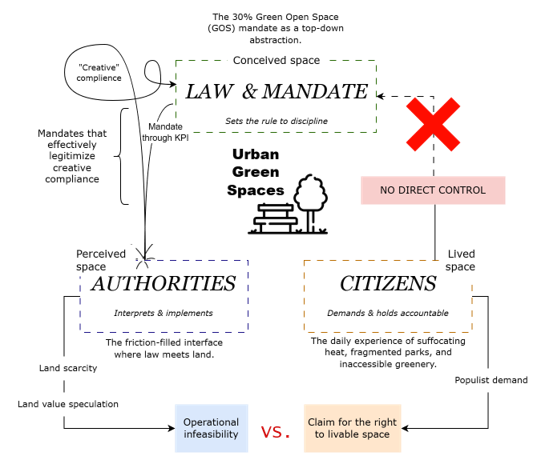
This article intervenes in debates on how law, ecology, and urban governance produce the idea of “green space.” Using Indonesia's 30% Green Open Space (GOS) mandate as a critical case, it argues that the legal abstraction of ecology into measurable quotas transforms environmental care into bureaucratic representation. In Jakarta, where land scarcity and political competition make the target unattainable, compliance is performed through the counting of roadside strips, cemeteries, and ornamental medians as green space. Drawing on Lefebvre's concept of the production of space, Harvey's spatial justice, and Jacobs's notion of lived urban vitality, the article shows how this abstraction privileges visibility and legitimacy over ecological function. Jakarta exemplifies a global urban condition in which sustainability becomes esthetic, green space becomes arithmetic, and law becomes landscape. The debates call for a redefinition of GOS as spatial care—a relational practice that distinguishes but connects ecological integrity and public accessibility. Moving beyond green quotas toward spatial care, it invites urban geography to reconsider how space is known, governed, and lived in the name of sustainability.
Indonesia’s urban green spaces dilemma: Balancing law, ecology, and public space, highlighting Jakarta
Mohammad Raditia Pradana#, Jarot Mulyo Semedi (# corresponding author)
Human Geography 2026
This article intervenes in debates on how law, ecology, and urban governance produce the idea of “green space.” Using Indonesia's 30% Green Open Space (GOS) mandate as a critical case, it argues that the legal abstraction of ecology into measurable quotas transforms environmental care into bureaucratic representation. In Jakarta, where land scarcity and political competition make the target unattainable, compliance is performed through the counting of roadside strips, cemeteries, and ornamental medians as green space. Drawing on Lefebvre's concept of the production of space, Harvey's spatial justice, and Jacobs's notion of lived urban vitality, the article shows how this abstraction privileges visibility and legitimacy over ecological function. Jakarta exemplifies a global urban condition in which sustainability becomes esthetic, green space becomes arithmetic, and law becomes landscape. The debates call for a redefinition of GOS as spatial care—a relational practice that distinguishes but connects ecological integrity and public accessibility. Moving beyond green quotas toward spatial care, it invites urban geography to reconsider how space is known, governed, and lived in the name of sustainability.
2025
A Methodological Exploration: Understanding Building Density and Flood Susceptibility in Urban Areas
Nadya Kamila, Ahmad Gamal#, Mohammad Raditia Pradana, Satria Indratmoko, Ardiansyah, Dwinanti Rika Marthanty (# corresponding author)
Urban Science 2026
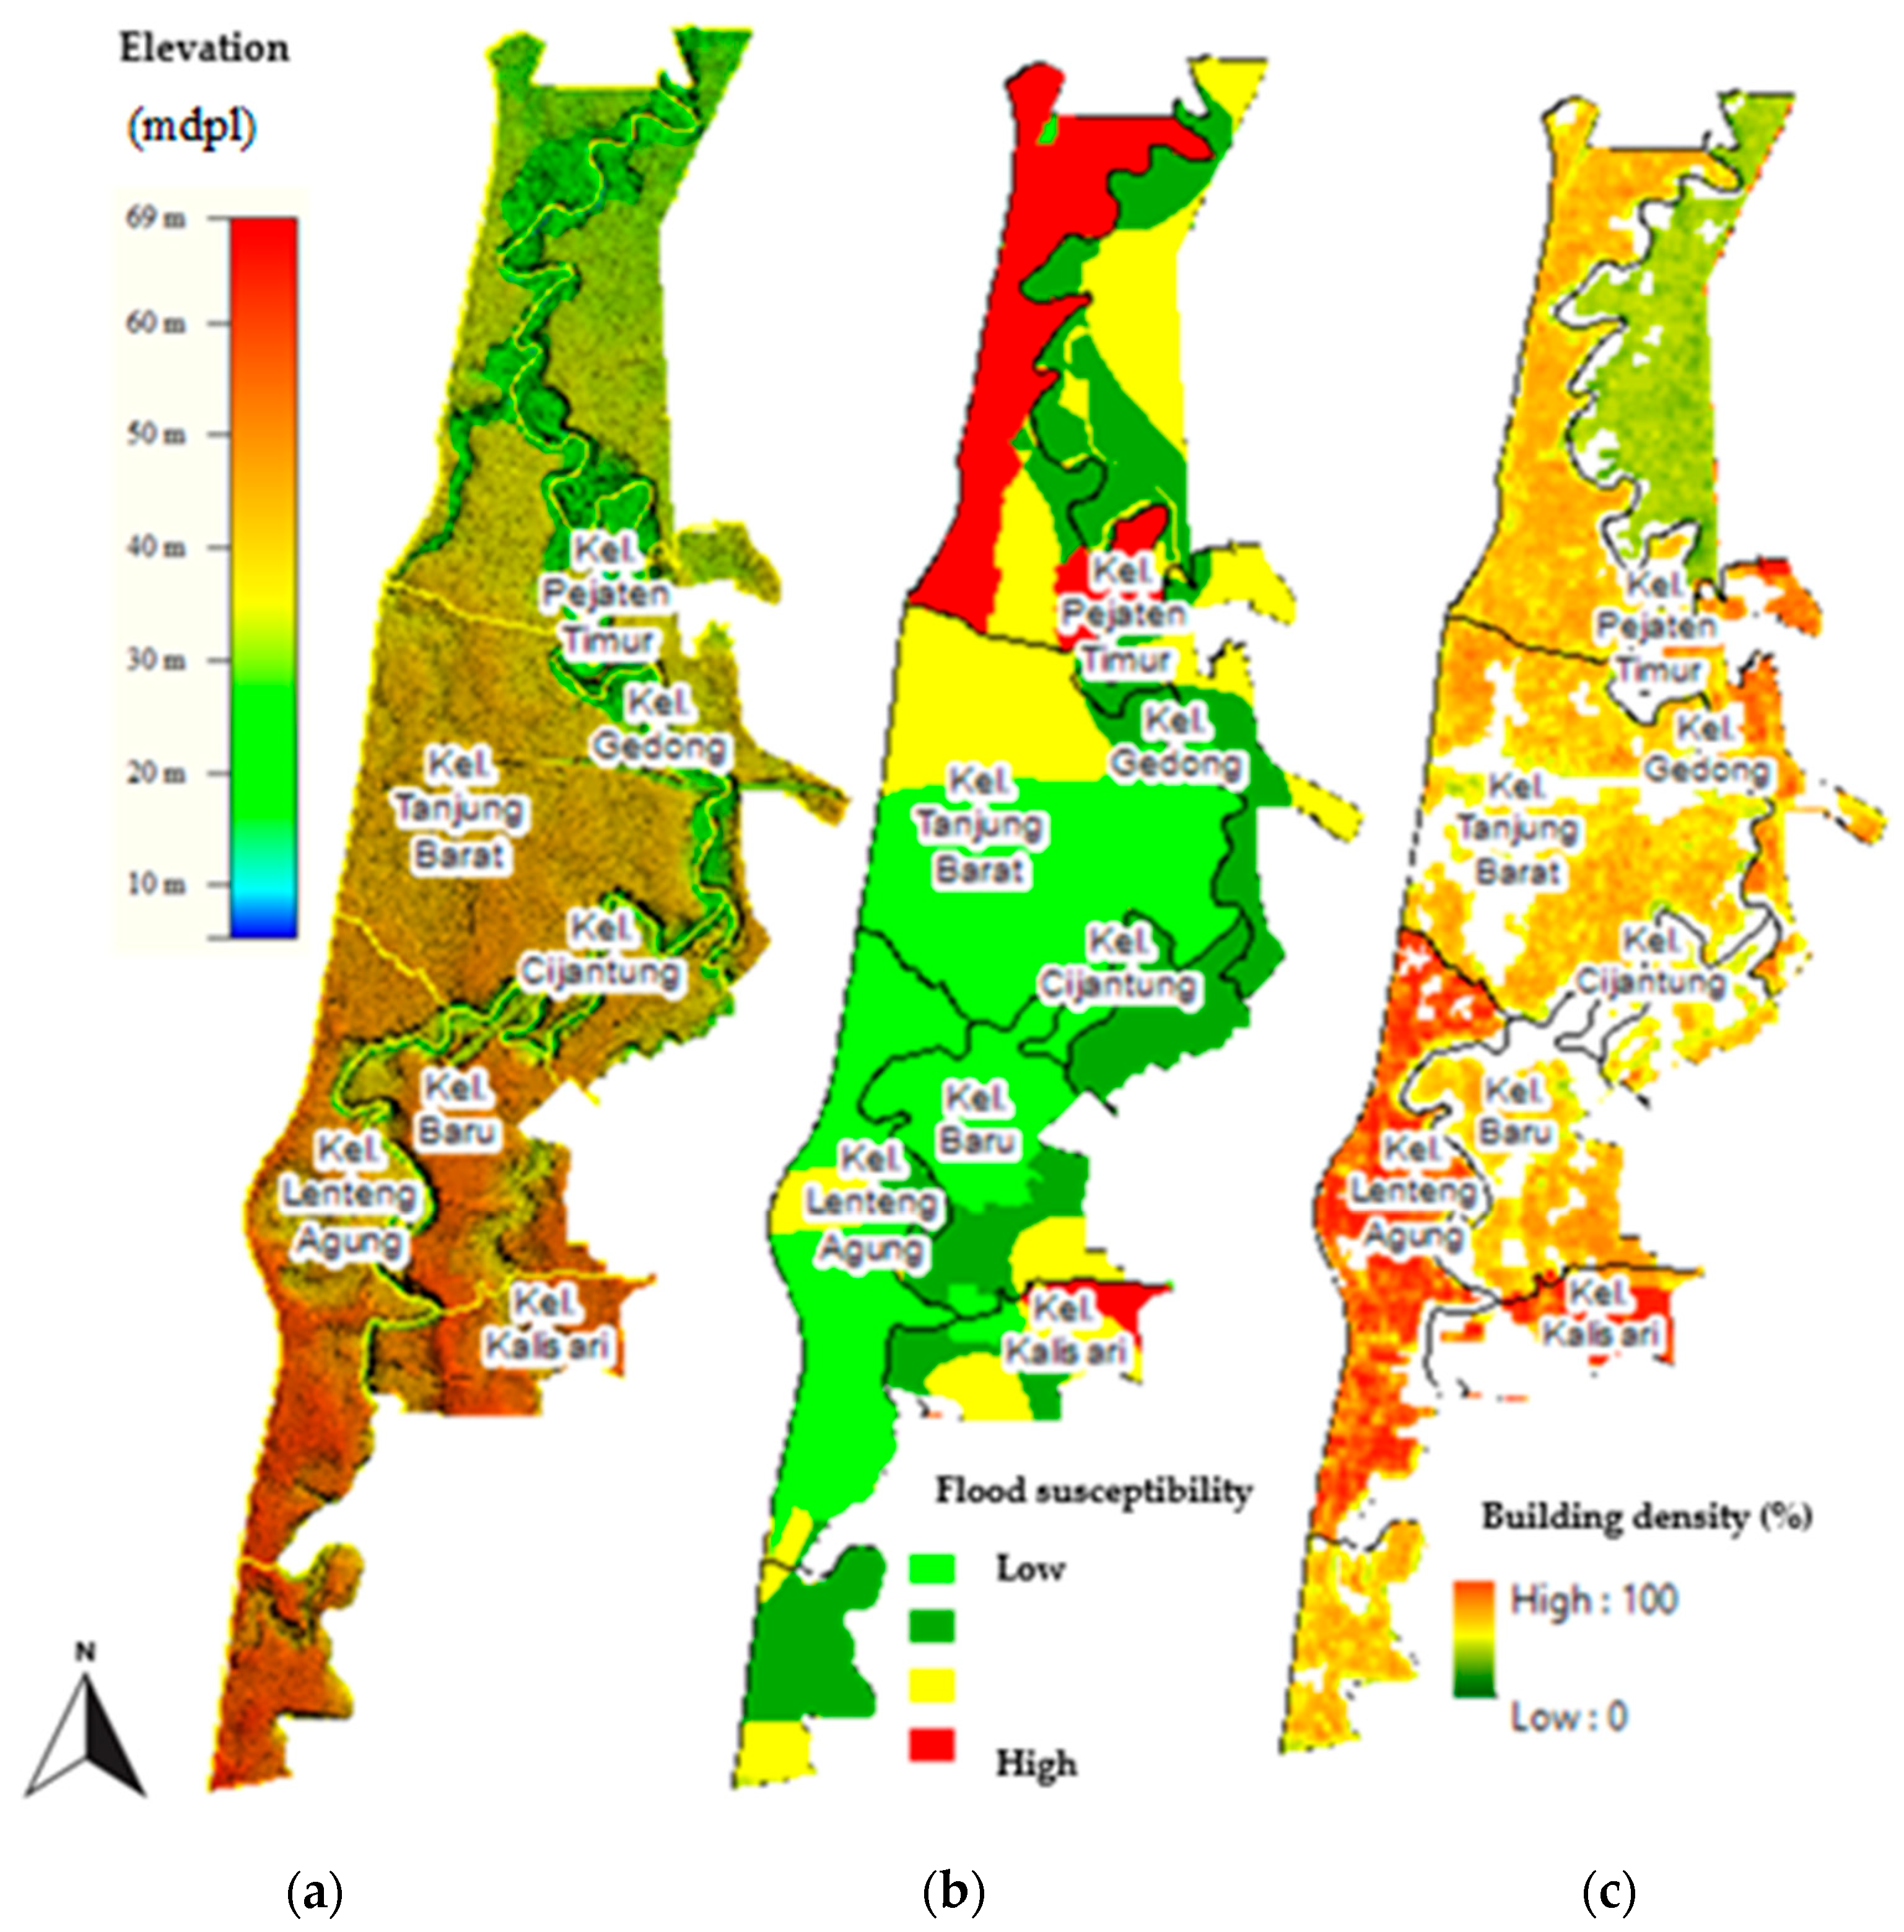
Rapid urbanization in developing megacities has exacerbated hydrological imbalances, positioning urban flooding as a major environmental and socio-economic challenge of the twenty-first century. This study investigates the spatial relationship between building density, topography, and flood susceptibility in Jakarta, Indonesia—one of the most flood-prone urban regions globally. Employing geospatial analysis and spatial autocorrelation techniques, the research assesses how variations in land-use concentration and elevation influence the spatial clustering of flood vulnerability. The analytical framework integrates multiple spatial datasets, including Digital Elevation Models (DEMs), building footprint densities, and flood hazard maps, within a Geographic Information System (GIS) environment. Spatial statistical measures, specifically Moran’s I and Local Indicators of Spatial Association (LISA), are utilized to quantify and visualize patterns of flood susceptibility. The findings reveal that zones characterized by high building density and low elevation form statistically significant clusters of heightened flood risk, particularly within the southern and eastern subdistricts of Jakarta. The study concludes that incorporating spatially explicit and statistically rigorous methodologies enhances the accuracy of flood-risk assessments and supports evidence-based strategies for sustainable urban development and resilience planning.
A Methodological Exploration: Understanding Building Density and Flood Susceptibility in Urban Areas
Nadya Kamila, Ahmad Gamal#, Mohammad Raditia Pradana, Satria Indratmoko, Ardiansyah, Dwinanti Rika Marthanty (# corresponding author)
Urban Science 2026
Rapid urbanization in developing megacities has exacerbated hydrological imbalances, positioning urban flooding as a major environmental and socio-economic challenge of the twenty-first century. This study investigates the spatial relationship between building density, topography, and flood susceptibility in Jakarta, Indonesia—one of the most flood-prone urban regions globally. Employing geospatial analysis and spatial autocorrelation techniques, the research assesses how variations in land-use concentration and elevation influence the spatial clustering of flood vulnerability. The analytical framework integrates multiple spatial datasets, including Digital Elevation Models (DEMs), building footprint densities, and flood hazard maps, within a Geographic Information System (GIS) environment. Spatial statistical measures, specifically Moran’s I and Local Indicators of Spatial Association (LISA), are utilized to quantify and visualize patterns of flood susceptibility. The findings reveal that zones characterized by high building density and low elevation form statistically significant clusters of heightened flood risk, particularly within the southern and eastern subdistricts of Jakarta. The study concludes that incorporating spatially explicit and statistically rigorous methodologies enhances the accuracy of flood-risk assessments and supports evidence-based strategies for sustainable urban development and resilience planning.
Unveiling greenery and visual comfort: Integrating Green View Index and image segmentation in panoramic rural landscapes
Mohammad Raditia Pradana#, Muhammad Dimyati, Jarot Mulyo Semedi (# corresponding author)
GeoScape 2025
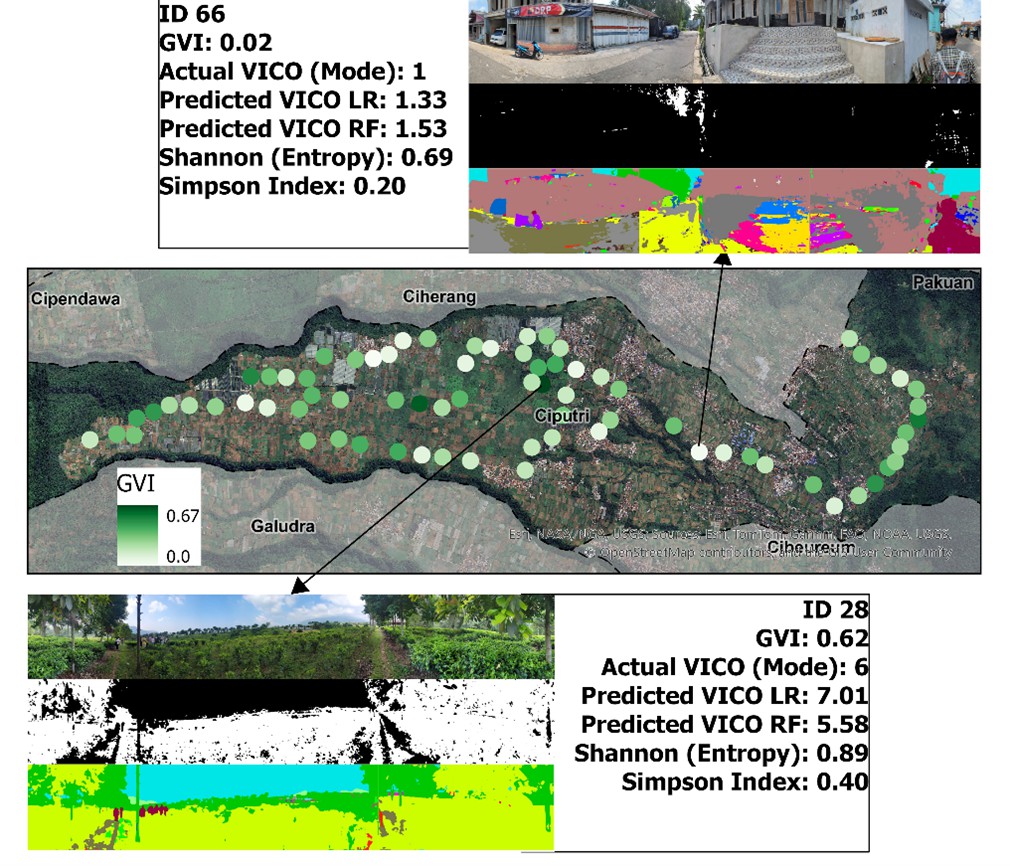
This study explores the intricate relationship between visual comfort (VICO) and greenery distribution – measured by the Green View Index (GVI) – alongside object composition in the rural landscapes of Ciputri Village, Indonesia. Using panoramic imagery and semantic segmentation models, dominant visual elements were identified, categorized, and analyzed for their contributions to landscape perception. The analysis combined linear regression and Random Forest modelling to evaluate the predictors of VICO. While the linear model showed limited explanatory power (R2 = 0.37), the Random Forest model (R2 = 0.60) performed substantially better, highlighting the importance of nonlinear relationships. Key findings reveal GVI as a dominant determinant of VICO, underscoring its substantial role in enhancing visual comfort. Specific objects such as trees, mountains, and the sky positively influenced VICO when visually dominant, whereas walls had the opposite effect. Unique patterns were observed for plants and “null” objects, with their contributions varying according to their positional dominance in the visual composition. For instance, plants in primary positions were associated with reduced VICO due to perceived monotony, but they enhanced VICO when secondary or tertiary, reflecting their role as complementary elements that enrich visual diversity. Overall, these results provide a nuanced understanding of the interplay between greenery, object composition, and visual comfort, suggesting that balanced visual diversity and strategic spatial arrangements can moderately shape landscape perception, with direct implications for rural landscape planning in Indonesia.
Unveiling greenery and visual comfort: Integrating Green View Index and image segmentation in panoramic rural landscapes
Mohammad Raditia Pradana#, Muhammad Dimyati, Jarot Mulyo Semedi (# corresponding author)
GeoScape 2025
This study explores the intricate relationship between visual comfort (VICO) and greenery distribution – measured by the Green View Index (GVI) – alongside object composition in the rural landscapes of Ciputri Village, Indonesia. Using panoramic imagery and semantic segmentation models, dominant visual elements were identified, categorized, and analyzed for their contributions to landscape perception. The analysis combined linear regression and Random Forest modelling to evaluate the predictors of VICO. While the linear model showed limited explanatory power (R2 = 0.37), the Random Forest model (R2 = 0.60) performed substantially better, highlighting the importance of nonlinear relationships. Key findings reveal GVI as a dominant determinant of VICO, underscoring its substantial role in enhancing visual comfort. Specific objects such as trees, mountains, and the sky positively influenced VICO when visually dominant, whereas walls had the opposite effect. Unique patterns were observed for plants and “null” objects, with their contributions varying according to their positional dominance in the visual composition. For instance, plants in primary positions were associated with reduced VICO due to perceived monotony, but they enhanced VICO when secondary or tertiary, reflecting their role as complementary elements that enrich visual diversity. Overall, these results provide a nuanced understanding of the interplay between greenery, object composition, and visual comfort, suggesting that balanced visual diversity and strategic spatial arrangements can moderately shape landscape perception, with direct implications for rural landscape planning in Indonesia.
Harmonizing street-view semantics and spatial predictors for dominant urban visual composition modelling
Mohammad Raditia Pradana#, Muhammad Dimyati, Ahmad Gamal (# corresponding author)
Computational Urban Science 2025 Spotlight
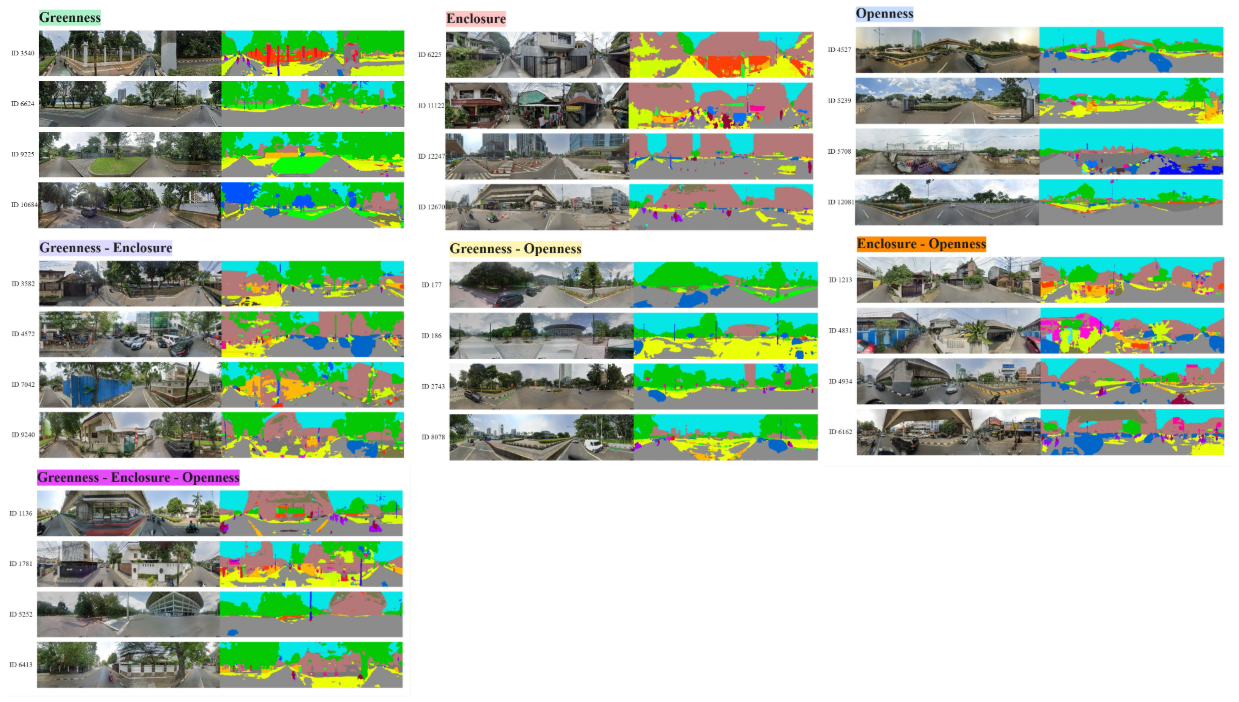
Street-level visual experiences are underrepresented in top-down spatial datasets such as remote sensing and spatial footprints, which predominantly capture configurations from an overhead perspective. This study develops a framework to model and map urban visual dominance, defined through seven typologies based on Greenness, Openness, and Enclosure. A total of 12,631 Google Street View panoramas were semantically segmented with a pretrained ADE20K deep learning model to extract proportions of trees, buildings, and sky. These proportions were aggregated into 50 m hexagonal grids and classified into visual dominance classes through rule-based logic. To predict these classes beyond street-view coverage, three scenarios of spatial predictors (remote sensing indices, building footprints, and their combination) were evaluated using five machine learning algorithms. Logistic Regression with combined predictors performed best, achieving an accuracy of 0.503 and an AUC-ROC up to 0.85 for the Greenness class. External validation against GHSL settlement data across six urban sites showed soft accuracy scores ranging from 22.33% to 67.23%, with better performance in structured environments than in fragmented residential settings. These findings highlight both the promise and limitations of generalizing street-view visual information from two-dimensional spatial features, offering a scalable approach to bridge the spatial coverage gap and support more human-centered urban landscape analysis.
Harmonizing street-view semantics and spatial predictors for dominant urban visual composition modelling
Mohammad Raditia Pradana#, Muhammad Dimyati, Ahmad Gamal (# corresponding author)
Computational Urban Science 2025 Spotlight
Street-level visual experiences are underrepresented in top-down spatial datasets such as remote sensing and spatial footprints, which predominantly capture configurations from an overhead perspective. This study develops a framework to model and map urban visual dominance, defined through seven typologies based on Greenness, Openness, and Enclosure. A total of 12,631 Google Street View panoramas were semantically segmented with a pretrained ADE20K deep learning model to extract proportions of trees, buildings, and sky. These proportions were aggregated into 50 m hexagonal grids and classified into visual dominance classes through rule-based logic. To predict these classes beyond street-view coverage, three scenarios of spatial predictors (remote sensing indices, building footprints, and their combination) were evaluated using five machine learning algorithms. Logistic Regression with combined predictors performed best, achieving an accuracy of 0.503 and an AUC-ROC up to 0.85 for the Greenness class. External validation against GHSL settlement data across six urban sites showed soft accuracy scores ranging from 22.33% to 67.23%, with better performance in structured environments than in fragmented residential settings. These findings highlight both the promise and limitations of generalizing street-view visual information from two-dimensional spatial features, offering a scalable approach to bridge the spatial coverage gap and support more human-centered urban landscape analysis.
Thematic Fragmentation and Convergence in Urban Flood Simulation Research: A 45-Year Bibliometric Mapping
Ahmad Gamal*#, Mohammad Raditia Pradana*, Bambang Hari Wibisono, Prananda Navitas, Jagannath Aryal (* equal contribution, # corresponding author)
Urban Science 2025
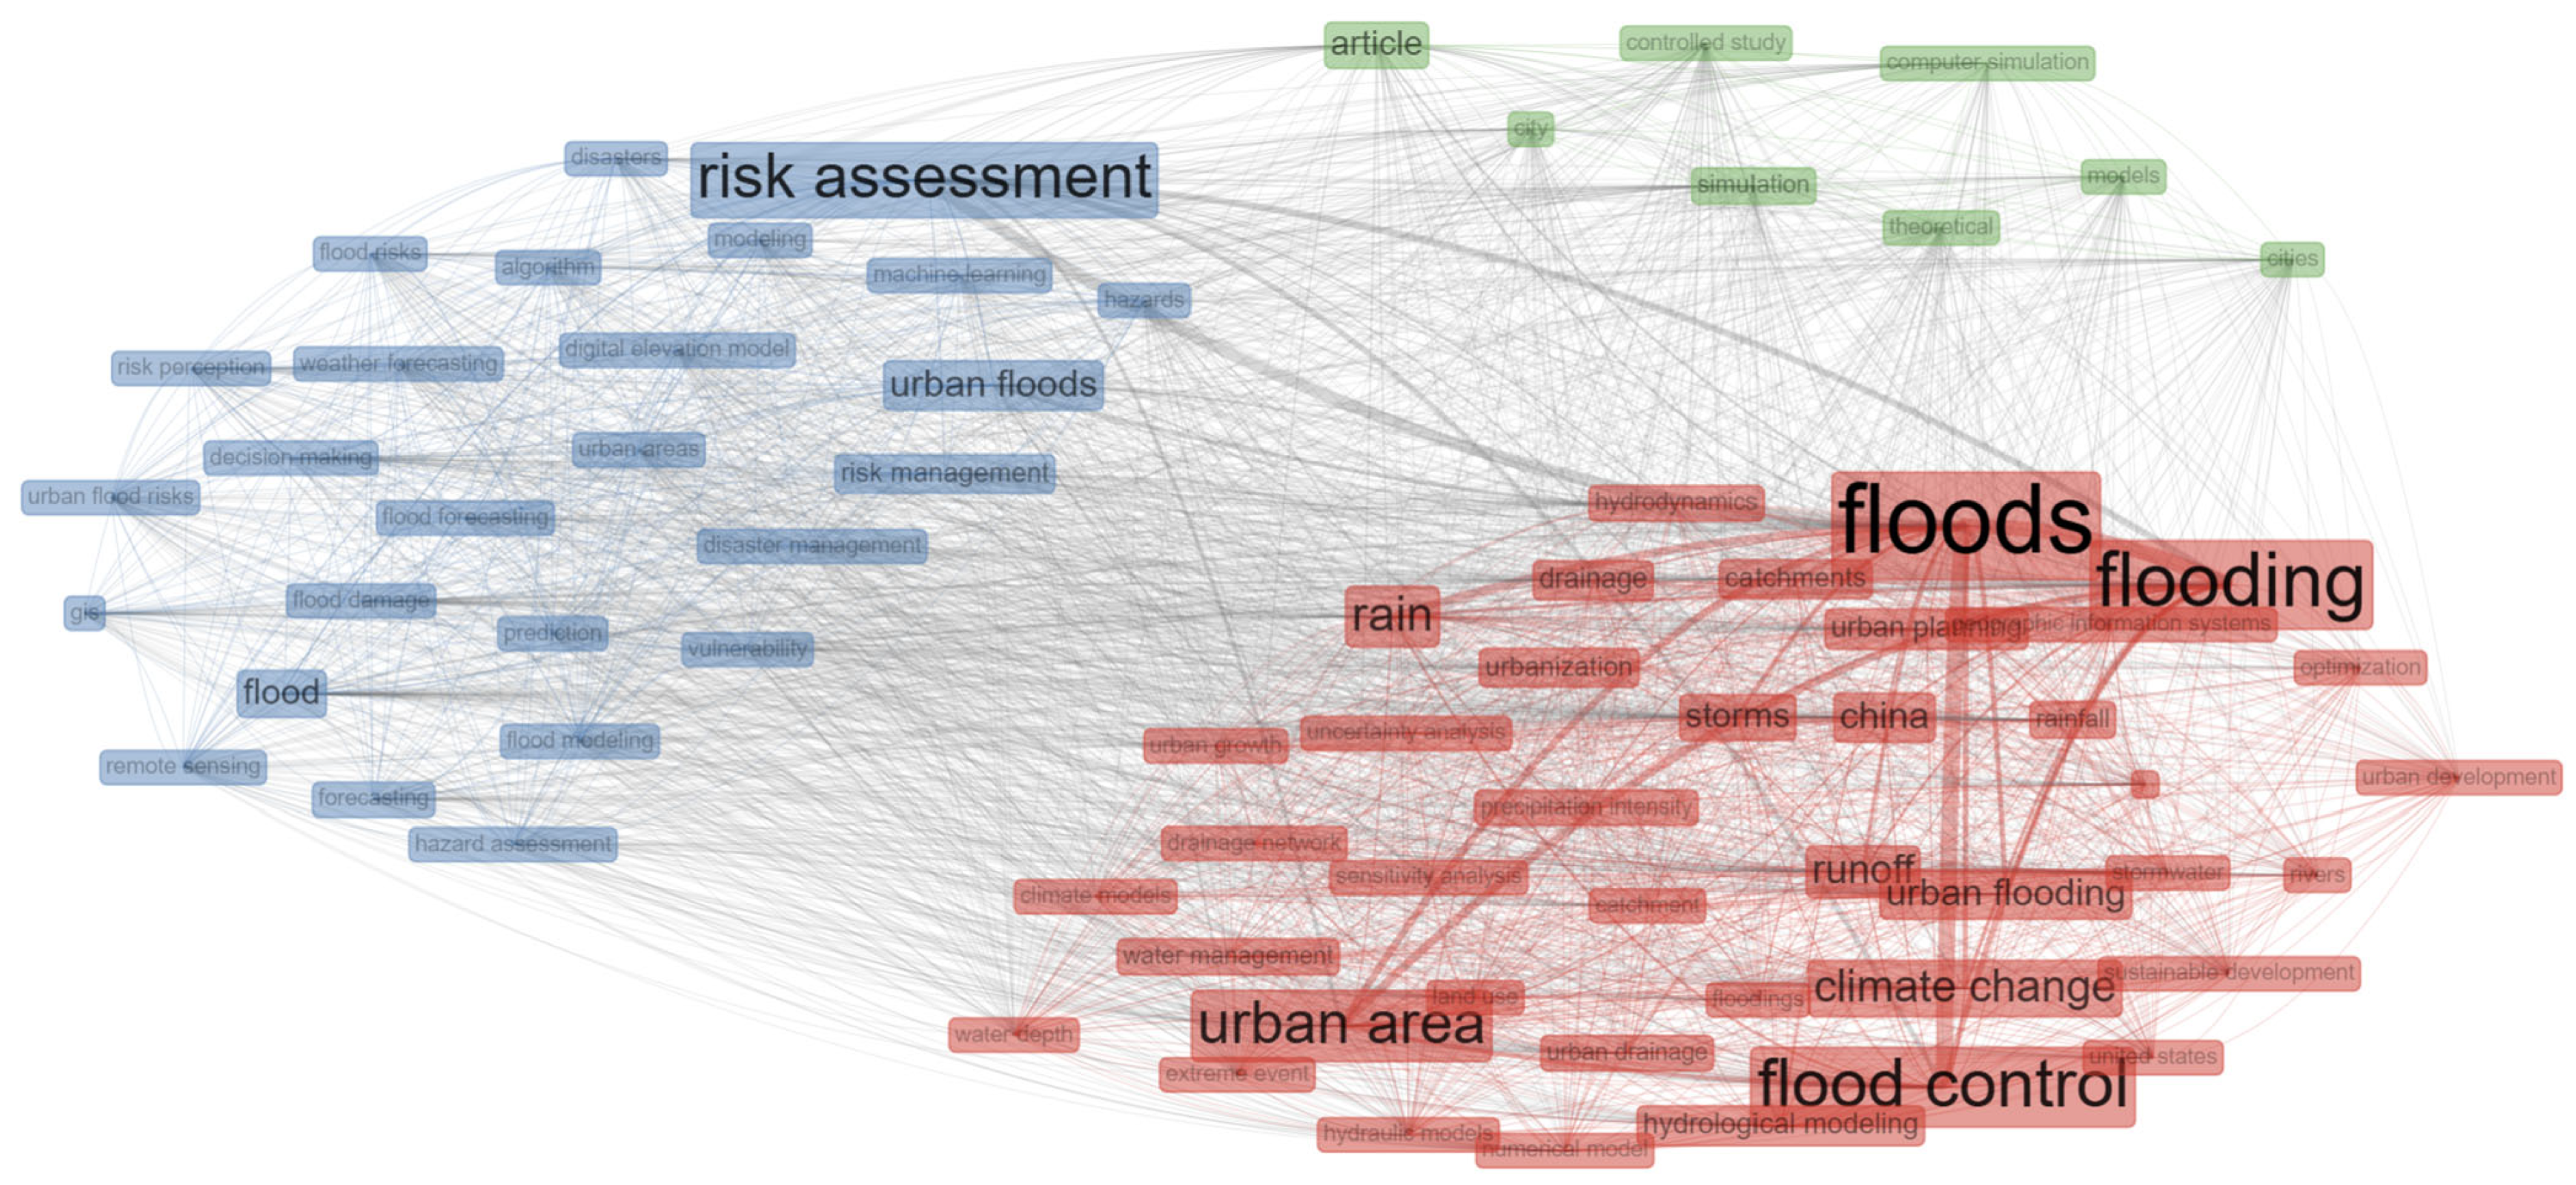
Urban flooding presents a growing challenge amid rapid urbanization, climate variability, and fragmented governance. Although simulation and risk assessment tools have advanced considerably, their integration into urban planning remains limited. This study utilized a comprehensive bibliometric analysis of 1293 articles from the Scopus database, selected through a PRISMA-guided workflow, to examine the temporal, structural, and conceptual evolution of simulation, flood risk, and planning in urban flood research from 1980 to 2025. The findings reveal a thematic progression from engineering-centric approaches to broader discourses on resilience, adaptation, and systemic risk. However, disciplinary fragmentation persists, with technical modeling, infrastructure planning, and governance still weakly connected. Despite a shared vocabulary around climate risk and resilience, practical integration into decision-making frameworks remains underdeveloped. The study highlights the need for more cohesive research-practice linkages and calls for frameworks that better align simulation outputs with urban planning imperatives.
Thematic Fragmentation and Convergence in Urban Flood Simulation Research: A 45-Year Bibliometric Mapping
Ahmad Gamal*#, Mohammad Raditia Pradana*, Bambang Hari Wibisono, Prananda Navitas, Jagannath Aryal (* equal contribution, # corresponding author)
Urban Science 2025
Urban flooding presents a growing challenge amid rapid urbanization, climate variability, and fragmented governance. Although simulation and risk assessment tools have advanced considerably, their integration into urban planning remains limited. This study utilized a comprehensive bibliometric analysis of 1293 articles from the Scopus database, selected through a PRISMA-guided workflow, to examine the temporal, structural, and conceptual evolution of simulation, flood risk, and planning in urban flood research from 1980 to 2025. The findings reveal a thematic progression from engineering-centric approaches to broader discourses on resilience, adaptation, and systemic risk. However, disciplinary fragmentation persists, with technical modeling, infrastructure planning, and governance still weakly connected. Despite a shared vocabulary around climate risk and resilience, practical integration into decision-making frameworks remains underdeveloped. The study highlights the need for more cohesive research-practice linkages and calls for frameworks that better align simulation outputs with urban planning imperatives.
Multi-Perspective Evaluation of Urban Green Views: Spatial and Street-View Data Integration in Sudirman Central Business District, Indonesia
Mohammad Raditia Pradana#, Adi Wibowo, Jarot Mulyo Semedi (# corresponding author)
Geomatics and Environmental Engineering 2025
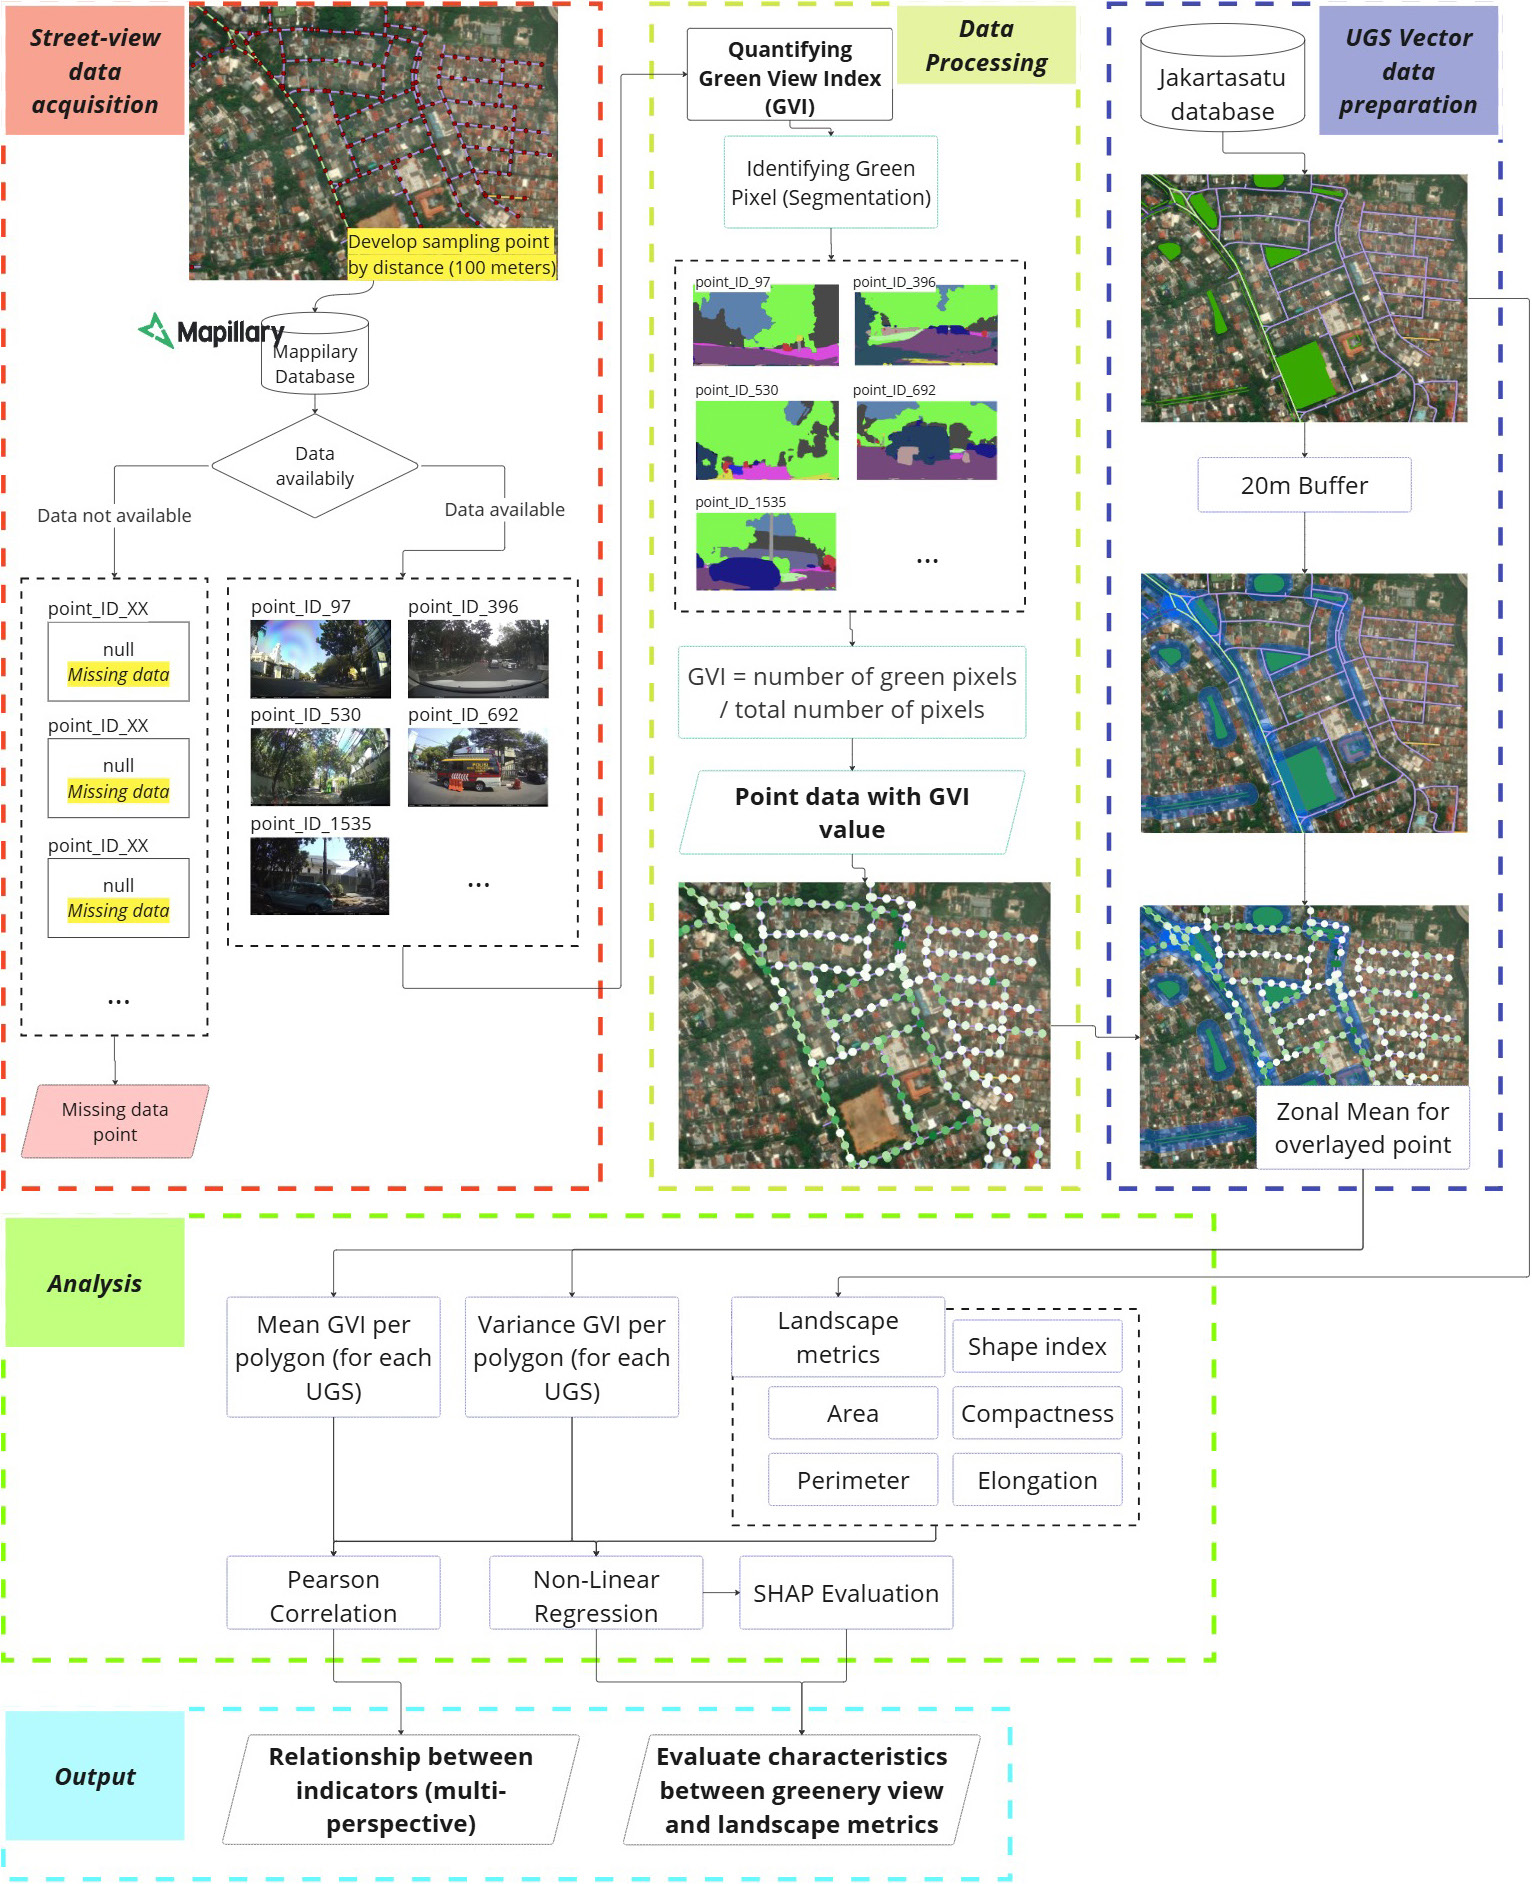
Urban green spaces (UGSs) are critical for enhancing urban livability and sustainability by providing both ecological and human-centered benefits. This study integrates spatial landscape metrics and the street-level visibility of greenery (measured through the green view index [GVI]) in order to evaluate the structural and visual characteristics of UGSs in a dynamic urban area – specifically, the Sudirman Central Business District (SCBD) of Jakarta, Indonesia. The analysis focuses on examining the roles of landscape metrics such as area, perimeter, compactness, shape index, and elongation in influencing the GVI and its spatial variability across different types of urban green spaces (including parks, green corridors, and open spaces). The results indicated that larger and more compact UGSs significantly contributed to higher GVI levels (thus, reflecting better visual greenery), while elongated and fragmented green spaces exhibited greater variability and lower visibility. Non-linear relationships (assessed through random forest regression and SHAP analysis) further revealed the complex interactions between GVI and landscape metrics, thus emphasizing the importance of incorporating advanced statistical approaches. The limitations that are related to data quality, temporal coverage, and spatial heterogeneity are also discussed, thus highlighting opportunities for future research for addressing these challenges through multi-temporal analyses and spatially explicit models. By bridging the gap between the spatial configurations and visual perception of UGSs, this study contributes to sustainable urban-planning strategies that are aimed at optimizing green spaces for ecological functionality and human well-being.
Multi-Perspective Evaluation of Urban Green Views: Spatial and Street-View Data Integration in Sudirman Central Business District, Indonesia
Mohammad Raditia Pradana#, Adi Wibowo, Jarot Mulyo Semedi (# corresponding author)
Geomatics and Environmental Engineering 2025
Urban green spaces (UGSs) are critical for enhancing urban livability and sustainability by providing both ecological and human-centered benefits. This study integrates spatial landscape metrics and the street-level visibility of greenery (measured through the green view index [GVI]) in order to evaluate the structural and visual characteristics of UGSs in a dynamic urban area – specifically, the Sudirman Central Business District (SCBD) of Jakarta, Indonesia. The analysis focuses on examining the roles of landscape metrics such as area, perimeter, compactness, shape index, and elongation in influencing the GVI and its spatial variability across different types of urban green spaces (including parks, green corridors, and open spaces). The results indicated that larger and more compact UGSs significantly contributed to higher GVI levels (thus, reflecting better visual greenery), while elongated and fragmented green spaces exhibited greater variability and lower visibility. Non-linear relationships (assessed through random forest regression and SHAP analysis) further revealed the complex interactions between GVI and landscape metrics, thus emphasizing the importance of incorporating advanced statistical approaches. The limitations that are related to data quality, temporal coverage, and spatial heterogeneity are also discussed, thus highlighting opportunities for future research for addressing these challenges through multi-temporal analyses and spatially explicit models. By bridging the gap between the spatial configurations and visual perception of UGSs, this study contributes to sustainable urban-planning strategies that are aimed at optimizing green spaces for ecological functionality and human well-being.
Effortless coastal monitoring: Unsupervised detection of shoreline alterations due to tin mining in Bangka Belitung
Mohammad Raditia Pradana#, Jarot Mulyo Semedi (# corresponding author)
IOP Conf. Series: Earth and Environmental Science 2026
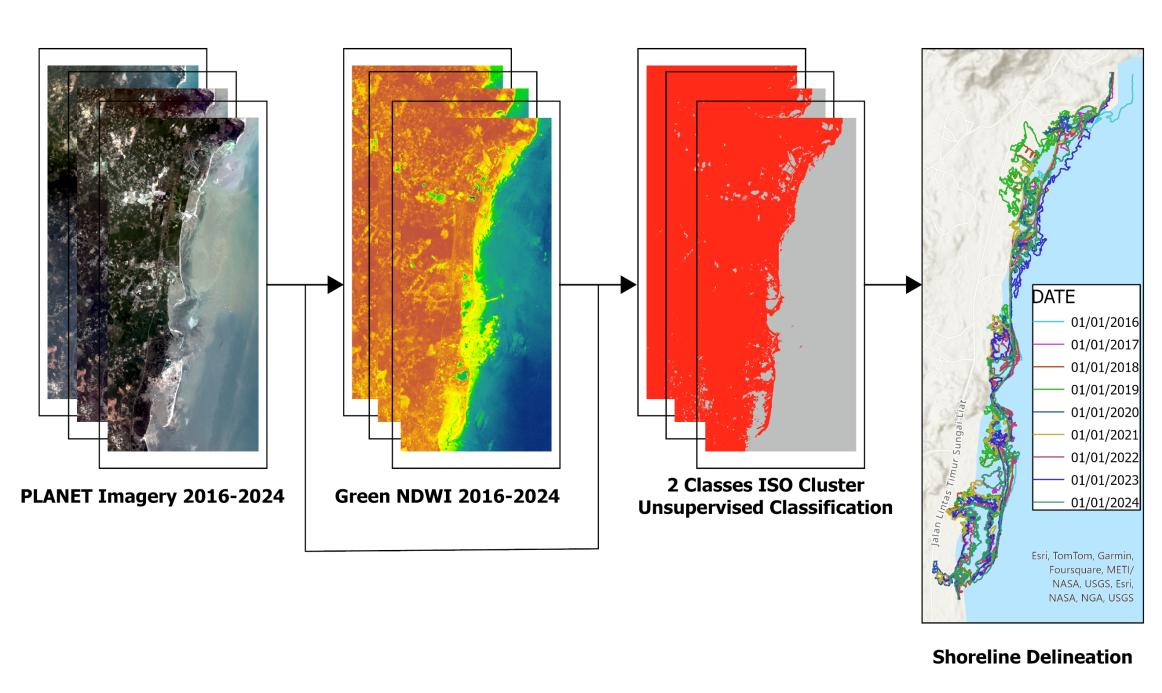
This study presents an innovative, unsupervised workflow for efficient coastal monitoring, focusing on detecting shoreline alterations due to tin mining in Bangka Belitung, Indonesia. Utilizing high-resolution PlanetScope imagery (2016-2024) and the Digital Shoreline Analysis System (DSAS), the research demonstrates a method for quantifying shoreline changes without relying on survey or in-situ data. The workflow integrates unsupervised classification techniques with DSAS analysis to provide comprehensive metrics of coastal dynamics. Results reveal significant shoreline variations, with 63.51% of analyzed transects showing accretion and 36.49% experiencing erosion. The average Shoreline Change Envelope (SCE) of 256.49 meters and Net Shoreline Movement (NSM) of 90.11 meters indicate substantial coastal changes. Linear Regression Rate (LRR) analysis shows an average change rate of 13.32 meters per year, highlighting rapid coastline transformation. This research effectively links observed shoreline changes to tin mining activities, providing valuable insights for coastal management and policy-making. The developed workflow’s efficiency and reliance on freely available data make it a promising tool for wider application in coastal areas facing similar challenges. While the study’s limitation lies in the absence of ground-truth validation to maintain workflow independence from field data, it offers a replicable methodology for monitoring mining-induced shoreline changes, contributing to sustainable coastal management practices.
Effortless coastal monitoring: Unsupervised detection of shoreline alterations due to tin mining in Bangka Belitung
Mohammad Raditia Pradana#, Jarot Mulyo Semedi (# corresponding author)
IOP Conf. Series: Earth and Environmental Science 2026
This study presents an innovative, unsupervised workflow for efficient coastal monitoring, focusing on detecting shoreline alterations due to tin mining in Bangka Belitung, Indonesia. Utilizing high-resolution PlanetScope imagery (2016-2024) and the Digital Shoreline Analysis System (DSAS), the research demonstrates a method for quantifying shoreline changes without relying on survey or in-situ data. The workflow integrates unsupervised classification techniques with DSAS analysis to provide comprehensive metrics of coastal dynamics. Results reveal significant shoreline variations, with 63.51% of analyzed transects showing accretion and 36.49% experiencing erosion. The average Shoreline Change Envelope (SCE) of 256.49 meters and Net Shoreline Movement (NSM) of 90.11 meters indicate substantial coastal changes. Linear Regression Rate (LRR) analysis shows an average change rate of 13.32 meters per year, highlighting rapid coastline transformation. This research effectively links observed shoreline changes to tin mining activities, providing valuable insights for coastal management and policy-making. The developed workflow’s efficiency and reliance on freely available data make it a promising tool for wider application in coastal areas facing similar challenges. While the study’s limitation lies in the absence of ground-truth validation to maintain workflow independence from field data, it offers a replicable methodology for monitoring mining-induced shoreline changes, contributing to sustainable coastal management practices.
2024
Tracking Urban Sprawl: A Systematic Review and Bibliometric Analysis of Spatio-Temporal Patterns Using Remote Sensing and GIS
Mohammad Raditia Pradana#, Muhammad Dimyati (# corresponding author)
European Journal of Geography 2024
The urban sprawl phenomenon refers to the expansion of urban areas driven by high population growth and migration. A spatio-temporal approach is indispensable in urban sprawl research. Monitoring and evaluating urban sprawl in a region is crucial for controlling drastic environmental changes. Integrated Remote Sensing (RS) and Geographic Information System (GIS) technologies can serve as essential tools for this purpose. The aim of this systematic literature review paper is to gather information on the latest data, methods, and findings to be considered in future urban sprawl research. The PRISMA method was employed, involving filtering from the Scopus database, resulting in 30 papers selected for an in-depth review to address the objectives of this paper. Landsat data remains the preferred choice for monitoring changes due to its extensive historical archive compared to other data sources. Landscape metrics represent a more advanced method com-pared to conventional change detection in quantifying urban sprawl. Other indices and quantifiers are also used to support the quantification of urban sprawl. Two perspectives exist in selecting the study's temporal intervals: consistent and inconsistent, which are adjusted based on the natural characteristics of "change," namely "abrupt" and "gradual." Suggestions for future research include using data with detailed spatial resolution and narrow study intervals while considering the patterns of urban sprawl formation.
Tracking Urban Sprawl: A Systematic Review and Bibliometric Analysis of Spatio-Temporal Patterns Using Remote Sensing and GIS
Mohammad Raditia Pradana#, Muhammad Dimyati (# corresponding author)
European Journal of Geography 2024
The urban sprawl phenomenon refers to the expansion of urban areas driven by high population growth and migration. A spatio-temporal approach is indispensable in urban sprawl research. Monitoring and evaluating urban sprawl in a region is crucial for controlling drastic environmental changes. Integrated Remote Sensing (RS) and Geographic Information System (GIS) technologies can serve as essential tools for this purpose. The aim of this systematic literature review paper is to gather information on the latest data, methods, and findings to be considered in future urban sprawl research. The PRISMA method was employed, involving filtering from the Scopus database, resulting in 30 papers selected for an in-depth review to address the objectives of this paper. Landsat data remains the preferred choice for monitoring changes due to its extensive historical archive compared to other data sources. Landscape metrics represent a more advanced method com-pared to conventional change detection in quantifying urban sprawl. Other indices and quantifiers are also used to support the quantification of urban sprawl. Two perspectives exist in selecting the study's temporal intervals: consistent and inconsistent, which are adjusted based on the natural characteristics of "change," namely "abrupt" and "gradual." Suggestions for future research include using data with detailed spatial resolution and narrow study intervals while considering the patterns of urban sprawl formation.
The Impedance of East Jakarta Road Network to Estimate Fire Station Service Areas
Jarot Mulyo Semedi*#, Mohammad Raditia Pradana*, Dhavani Ardyas Putera, Nurul Sri Rahatiningtyas (* equal contribution, # corresponding author)
Forum Geografi 2024
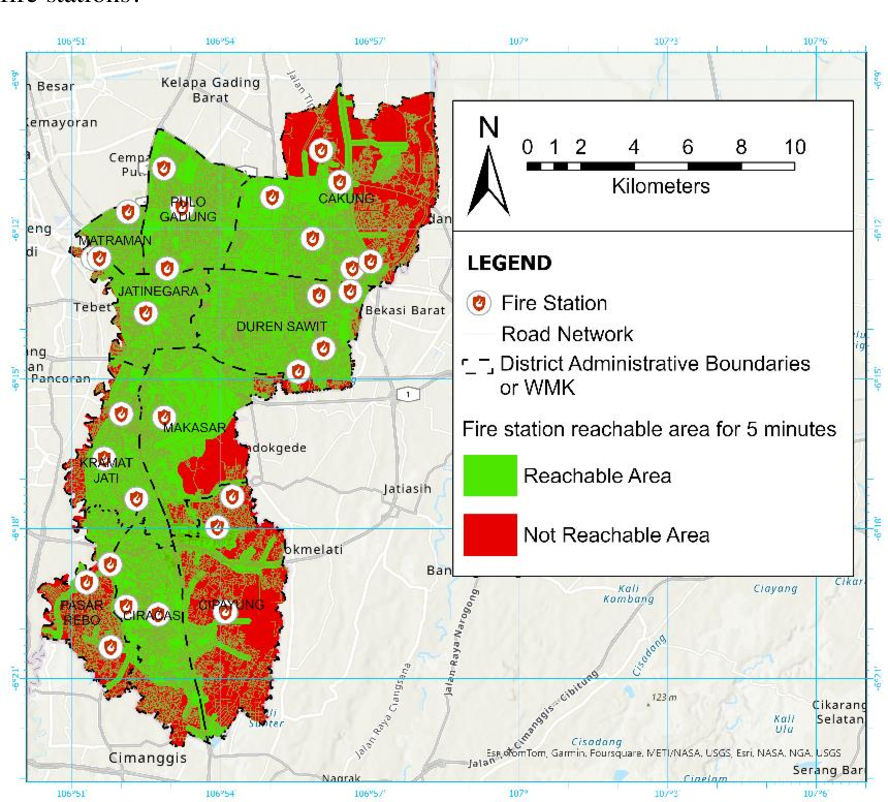
Urban fires, prevalent in densely populated areas, pose significant risks by increasing deaths and injuries. Fire departments must navigate challenging access routes to manage these incidents effectively. This study analyzes the service coverage of fire stations in East Jakarta, considering road network, width, speed, and travel time. The study utilizes secondary data from the DKI Jakarta Provincial Fire and Rescue Service, road network data from local government sources, and traffic data from Google Maps. Additionally, a field survey was conducted to validate road conditions and accessibility. Using graph theory-based network analysis, the study assesses connectivity, flows, directions, and destinations to determine the coverage extent. The optimal route, defined by road class, width, and condition, exhibits the lowest impedance. Google Maps’ estimated travel times, incorporating traffic conditions, are used to assess travel times, with a 5-minute travel time set as the standard barrier for coverage. Results reveal that the current service coverage of East Jakarta fire stations is only 66.57%. This disparity indicates an inadequate number of fire stations relative to their required service areas. The findings underscore the need for strategic placement of additional fire stations and potential improvements in road infrastructure to enhance response times. Traffic dynamics often affect travel times, demonstrating that shorter distances do not always result in faster arrivals according to real-time data.
The Impedance of East Jakarta Road Network to Estimate Fire Station Service Areas
Jarot Mulyo Semedi*#, Mohammad Raditia Pradana*, Dhavani Ardyas Putera, Nurul Sri Rahatiningtyas (* equal contribution, # corresponding author)
Forum Geografi 2024
Urban fires, prevalent in densely populated areas, pose significant risks by increasing deaths and injuries. Fire departments must navigate challenging access routes to manage these incidents effectively. This study analyzes the service coverage of fire stations in East Jakarta, considering road network, width, speed, and travel time. The study utilizes secondary data from the DKI Jakarta Provincial Fire and Rescue Service, road network data from local government sources, and traffic data from Google Maps. Additionally, a field survey was conducted to validate road conditions and accessibility. Using graph theory-based network analysis, the study assesses connectivity, flows, directions, and destinations to determine the coverage extent. The optimal route, defined by road class, width, and condition, exhibits the lowest impedance. Google Maps’ estimated travel times, incorporating traffic conditions, are used to assess travel times, with a 5-minute travel time set as the standard barrier for coverage. Results reveal that the current service coverage of East Jakarta fire stations is only 66.57%. This disparity indicates an inadequate number of fire stations relative to their required service areas. The findings underscore the need for strategic placement of additional fire stations and potential improvements in road infrastructure to enhance response times. Traffic dynamics often affect travel times, demonstrating that shorter distances do not always result in faster arrivals according to real-time data.
Biomass Stock Estimation Using Landsat 8 Imagery in Bukit Tigapuluh National Park, Riau
Iqbal Putut Ash-Shidiq*#, Supriatna, A Darmawan, Z Warta, E Molidena, A Valla, Hisan, M I Firdaus, N A Zakaria, Salsa Muafiroh, Mohammad Raditia Pradana*, Dhavani Ardyas Putera (* equal contribution, # corresponding author)
IOP Conf. Series: Earth and Environmental Science 2024
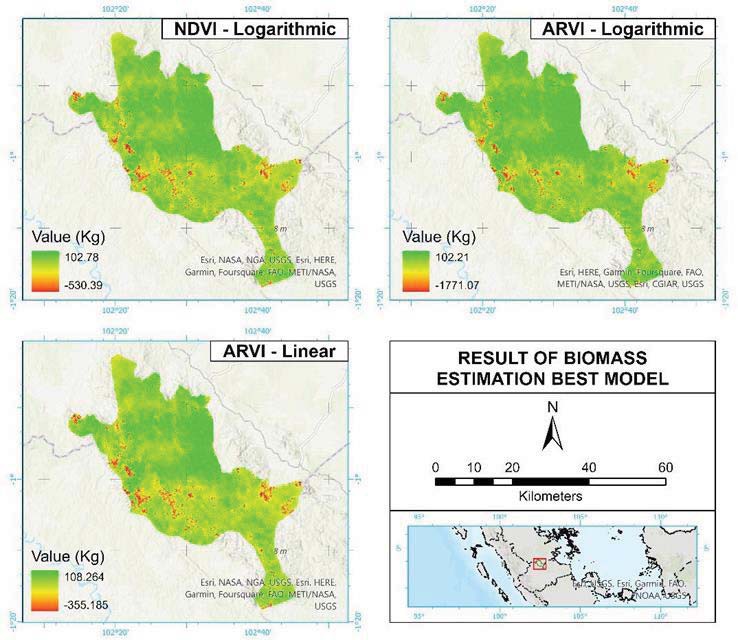
Forests certainly store biomass content which is reflected in the physical appearance of a tree. In calculating biomass directly, direct surveys and measurements are needed. Remote sensing technology, in this case, is a tool for monitoring and calculating the biomass content of vegetation. In estimating biomass using remote sensing, the biomass content of vegetation in the field is still needed. This study aimed to estimate the biomass content of the Meranti plant (Shorea parvifolia Dyer), which is the dominant plant species in the Bukit Tigapuluh National Park in Indragiri Hulu and Indragiri Hilir Regencies, Riau Province and Tebo Regencies and Tanjung Jabung Barat Regencies in Jambi Province with using Landsat 8 imagery. Field measurements and remote sensing images, which in this case are vegetation indices in the form of NDVI, ARVI, GNDVI, MSAVI2, and EVI, will produce a biomass estimation model, and the most suitable model will be selectively selected based on the strength of the relationship between the two parameters. The resulting model between the biomass value and the vegetation index will then become an estimate of the biomass of the dominant plant species in Bukit Tigapuluh National Park.
Biomass Stock Estimation Using Landsat 8 Imagery in Bukit Tigapuluh National Park, Riau
Iqbal Putut Ash-Shidiq*#, Supriatna, A Darmawan, Z Warta, E Molidena, A Valla, Hisan, M I Firdaus, N A Zakaria, Salsa Muafiroh, Mohammad Raditia Pradana*, Dhavani Ardyas Putera (* equal contribution, # corresponding author)
IOP Conf. Series: Earth and Environmental Science 2024
Forests certainly store biomass content which is reflected in the physical appearance of a tree. In calculating biomass directly, direct surveys and measurements are needed. Remote sensing technology, in this case, is a tool for monitoring and calculating the biomass content of vegetation. In estimating biomass using remote sensing, the biomass content of vegetation in the field is still needed. This study aimed to estimate the biomass content of the Meranti plant (Shorea parvifolia Dyer), which is the dominant plant species in the Bukit Tigapuluh National Park in Indragiri Hulu and Indragiri Hilir Regencies, Riau Province and Tebo Regencies and Tanjung Jabung Barat Regencies in Jambi Province with using Landsat 8 imagery. Field measurements and remote sensing images, which in this case are vegetation indices in the form of NDVI, ARVI, GNDVI, MSAVI2, and EVI, will produce a biomass estimation model, and the most suitable model will be selectively selected based on the strength of the relationship between the two parameters. The resulting model between the biomass value and the vegetation index will then become an estimate of the biomass of the dominant plant species in Bukit Tigapuluh National Park.